Visualisation de données - correction - ggplot()
Programmation statistique avec R - STID 2ème année
library(ggplot2)
library(reshape2)
Vous devez faire les questions suivantes avec la fonction qplot() puis avec la fonction ggplot().
Iris
Dans les données iris, représenter les boîtes à moustaches des 4 variables pour les trois espèces.
ggplot(melt(iris, id = "Species"), aes(Species, value)) +
    geom_boxplot() +
    facet_grid(~ variable) +
    theme(axis.text.x = element_text(angle = 45, hjust = 1))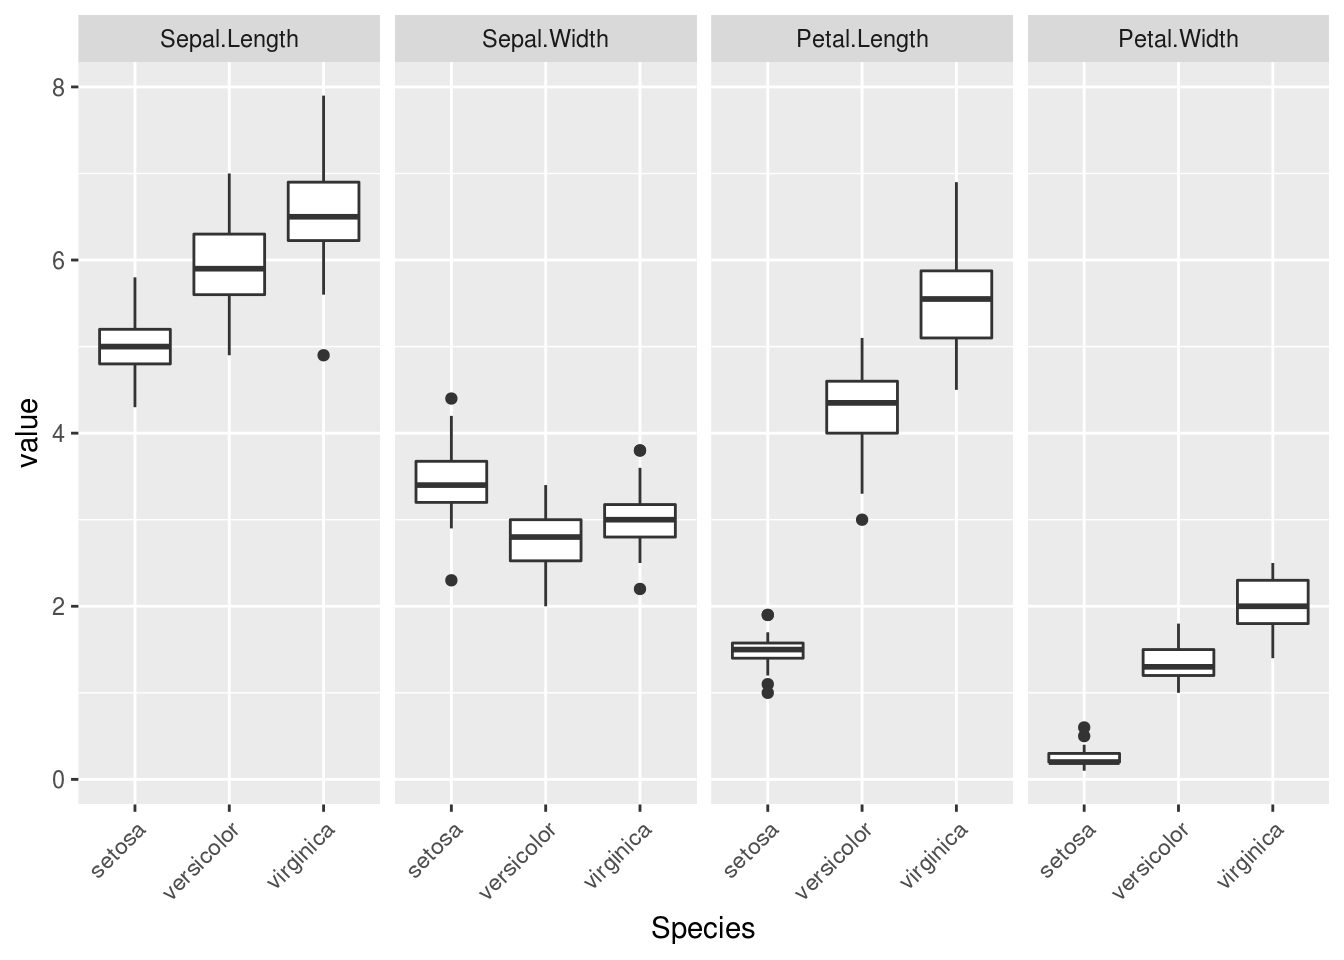
Tips
Dans les données tips du package reshape2, représenter total_bill en fonction de sex et smoker.
ggplot(tips, aes(0, total_bill)) +
    geom_boxplot() +
    facet_grid(sex ~ smoker, labeller = label_both)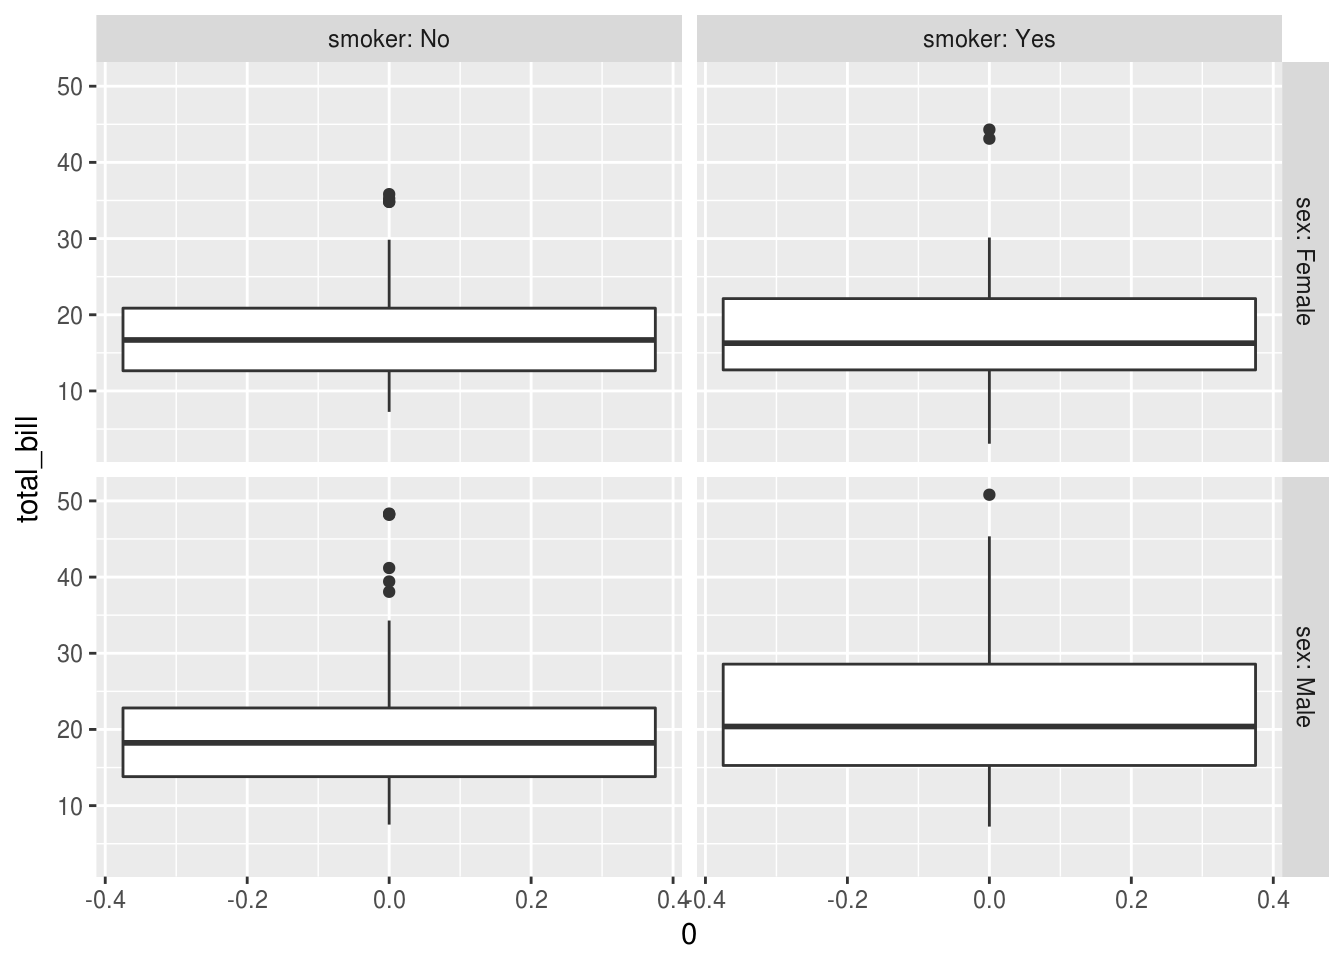
ggplot(tips, aes(0, total_bill)) +
    geom_boxplot() +
    facet_grid( ~ sex + smoker, labeller = label_both)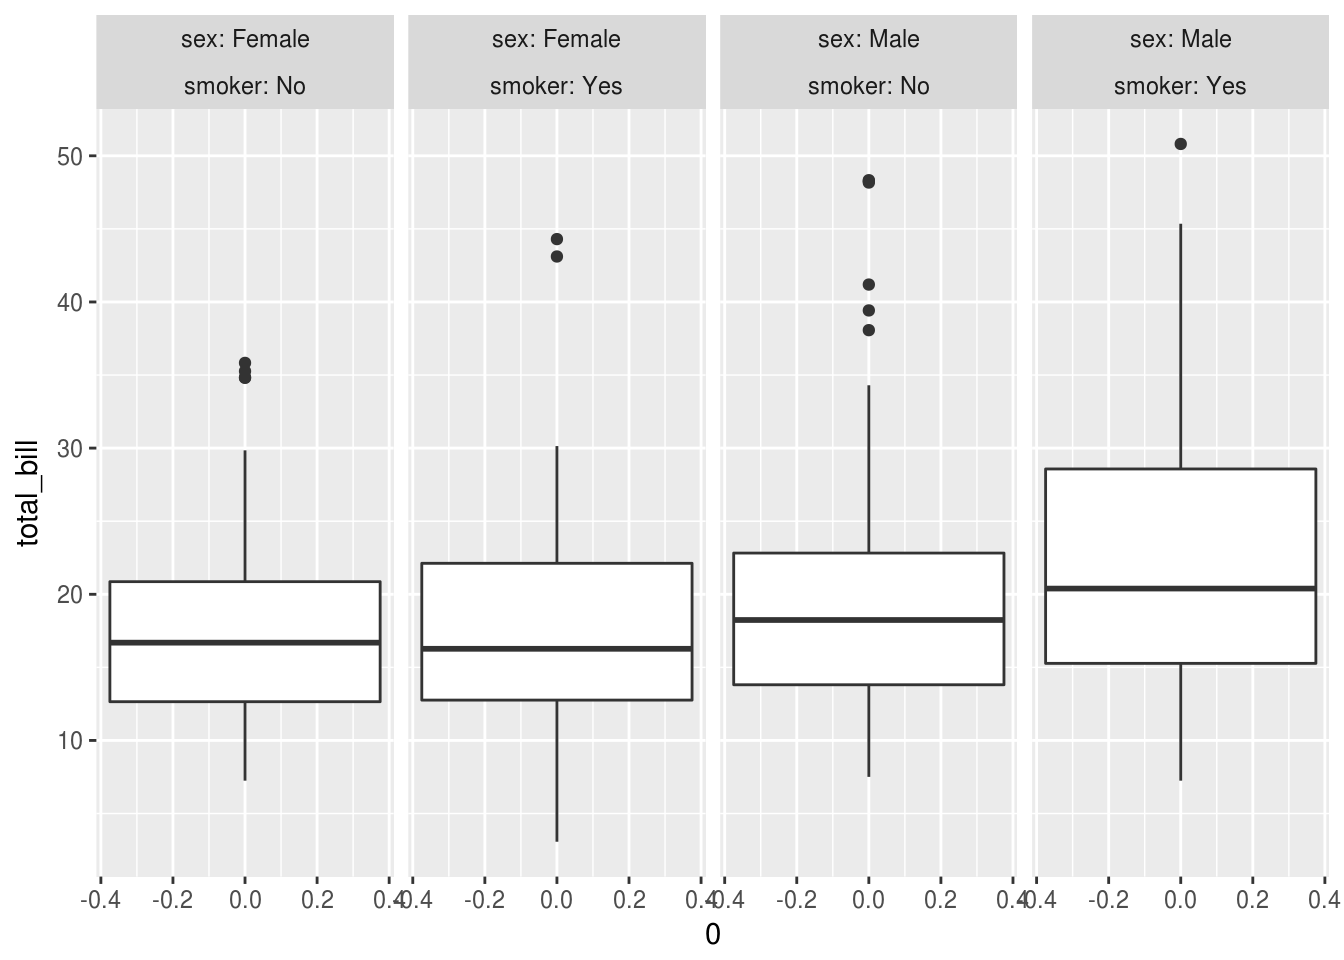
ggplot(tips, aes(sex, total_bill)) +
    geom_boxplot() +
    facet_grid( ~ smoker, labeller = label_both)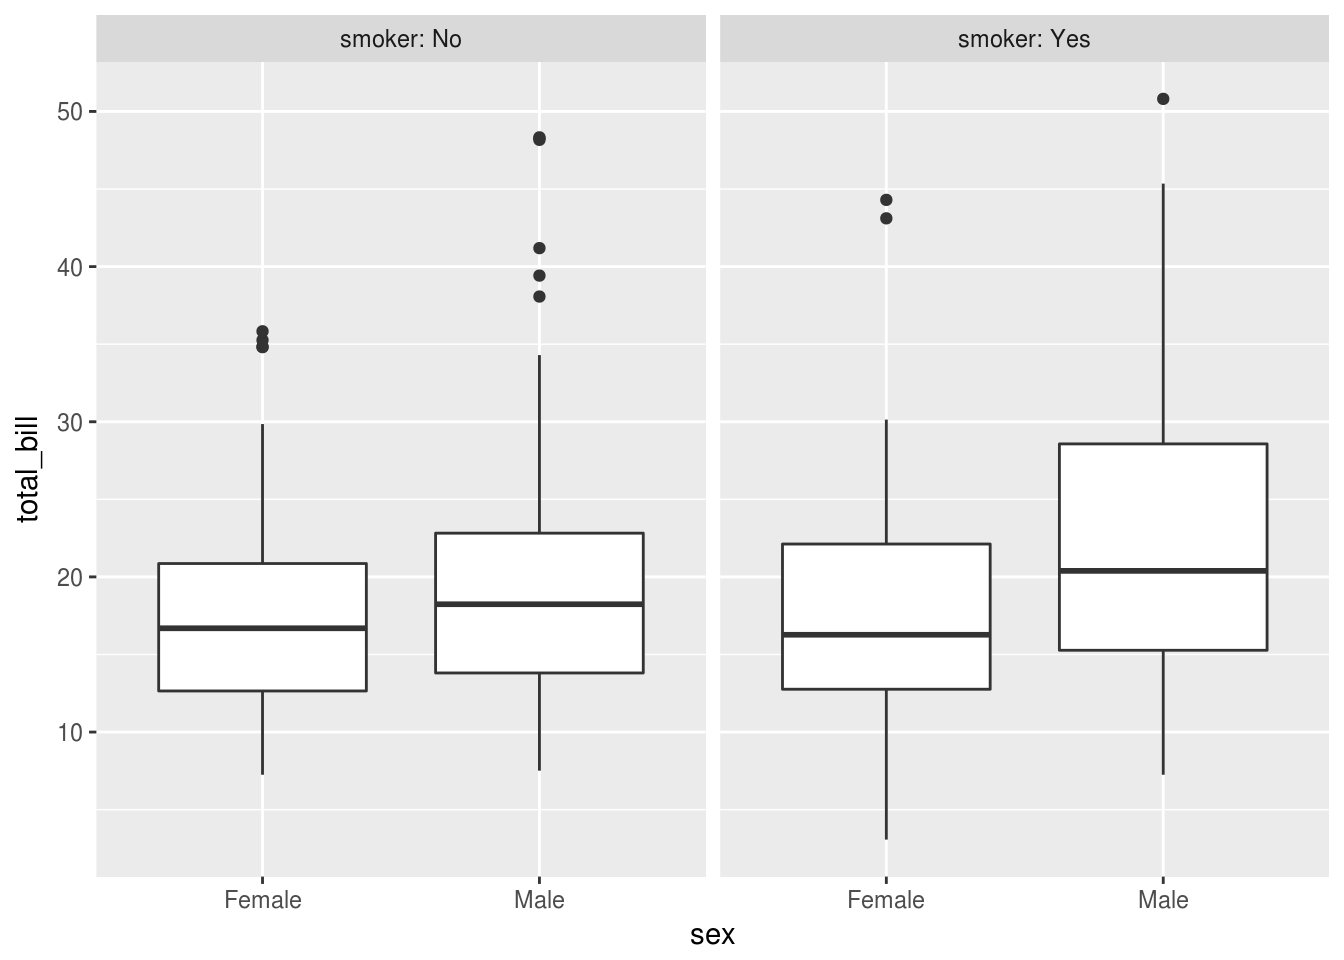
ggplot(aggregate(total_bill ~ sex + smoker, tips, median),
       aes(sex, smoker, fill = total_bill)) +
    geom_bin2d()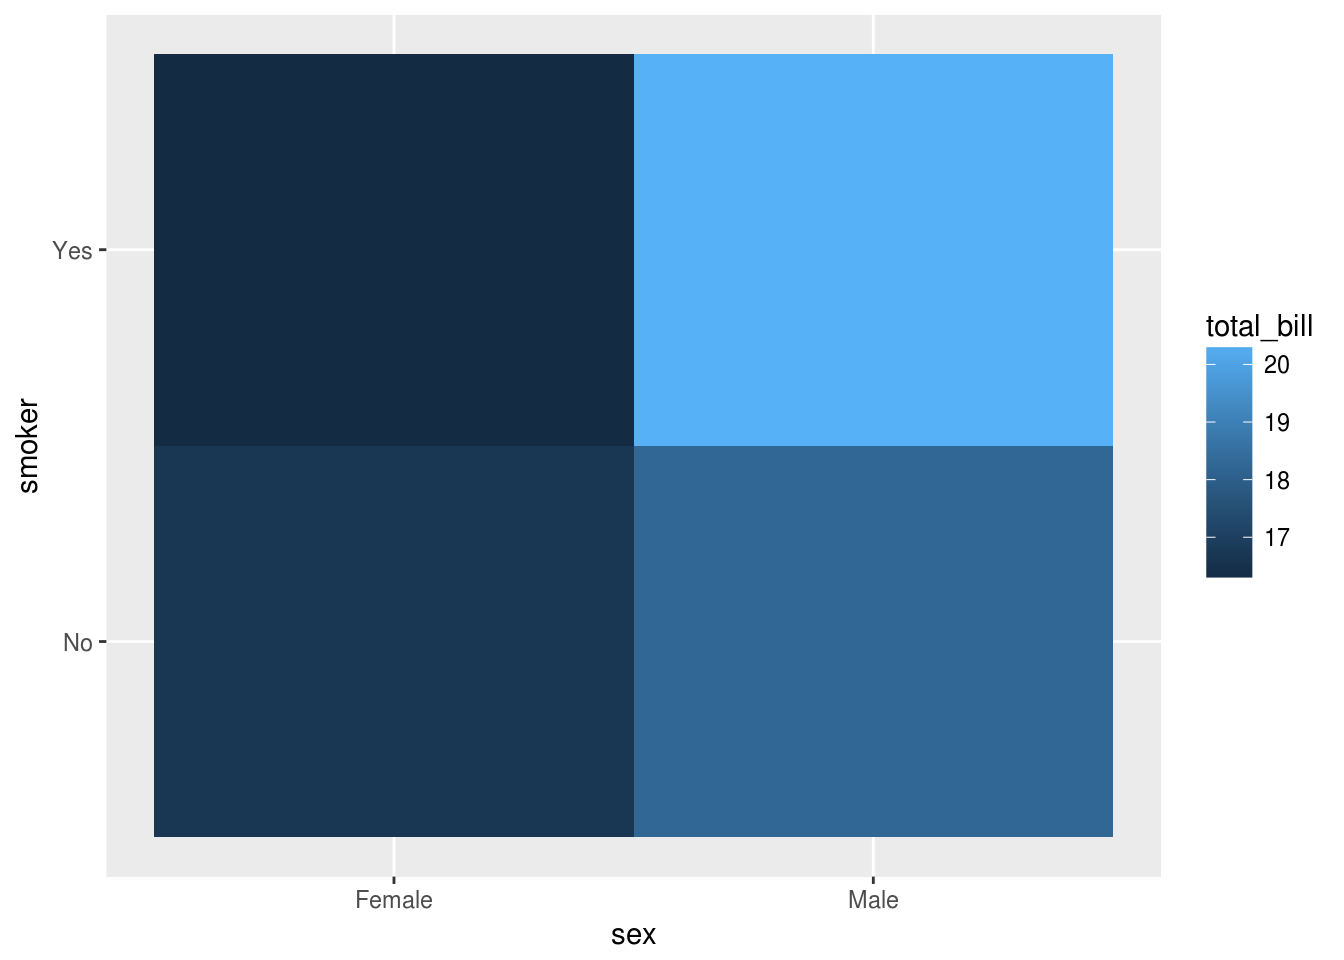
Toujours dans tips, représenter total_bill et tip, en fonction de sex de 2 façons
ggplot(tips, aes(total_bill, tip, color = sex)) +
    geom_point() +
    geom_smooth(method = "lm") +
    facet_grid(~ sex)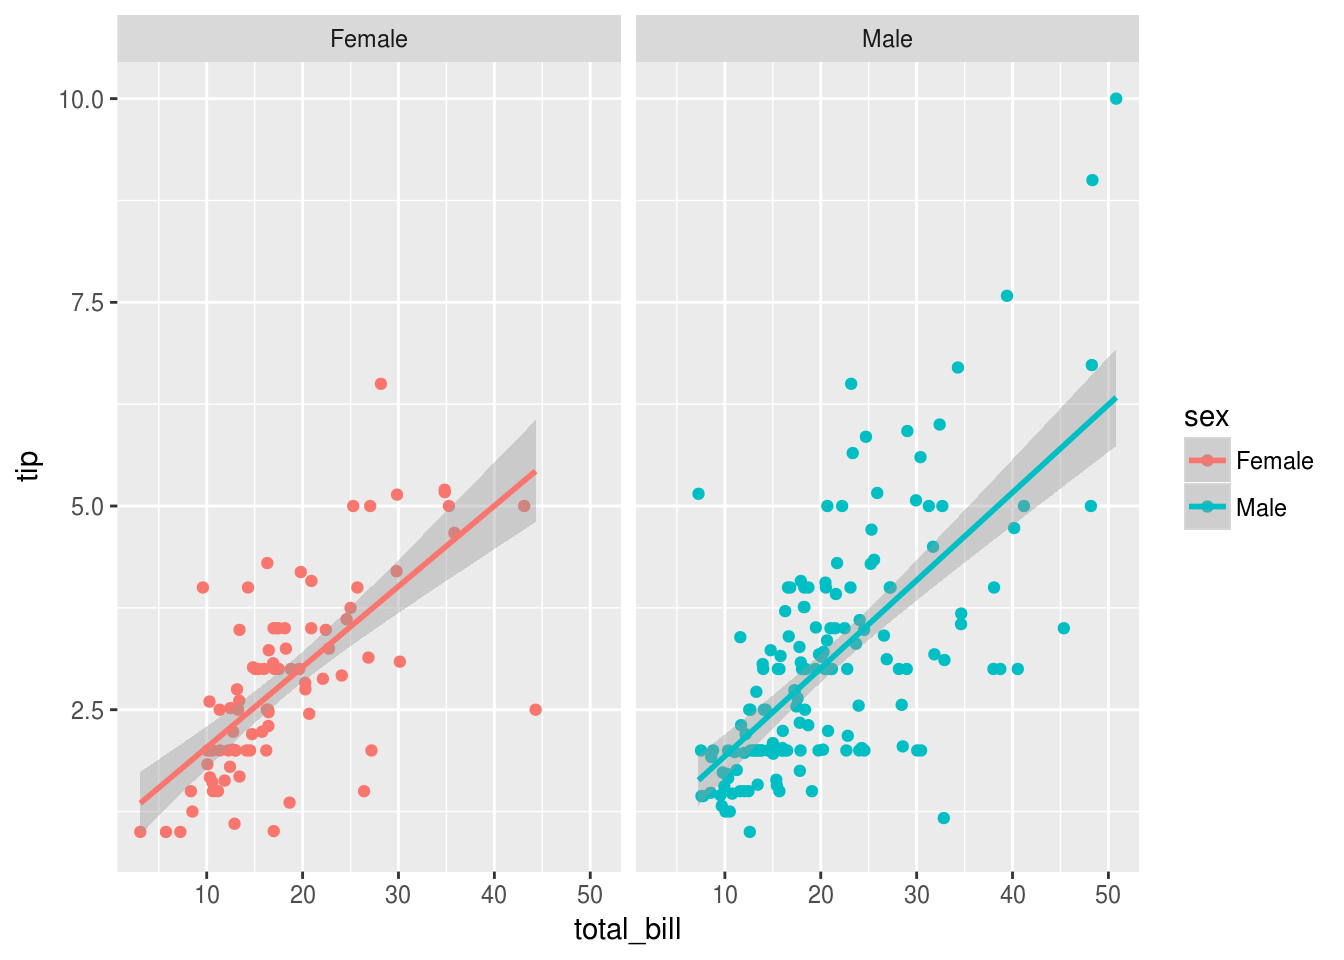
ggplot(tips, aes(cut(total_bill, 5), tip, fill = sex)) +
    geom_boxplot() +
    facet_grid(~ sex) +
    theme(axis.text.x = element_text(angle = 45, hjust = 1))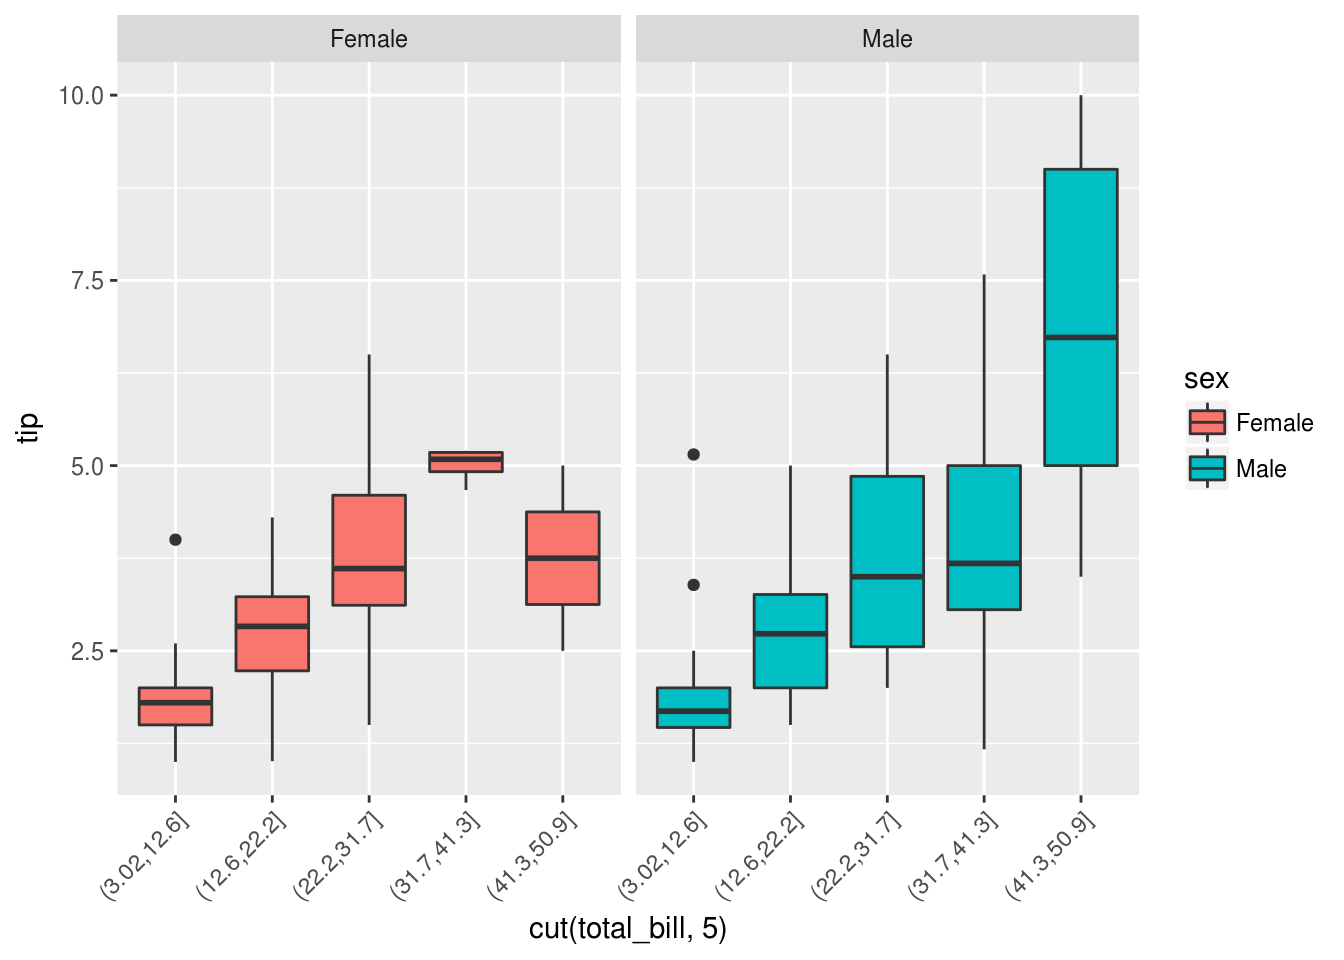
ggplot(aggregate(tip ~ sex + total_bill_cut,
                 transform(tips, total_bill_cut = cut(total_bill, 5)),
                 median),
       aes(total_bill_cut, sex, fill = tip)) +
    geom_bin2d()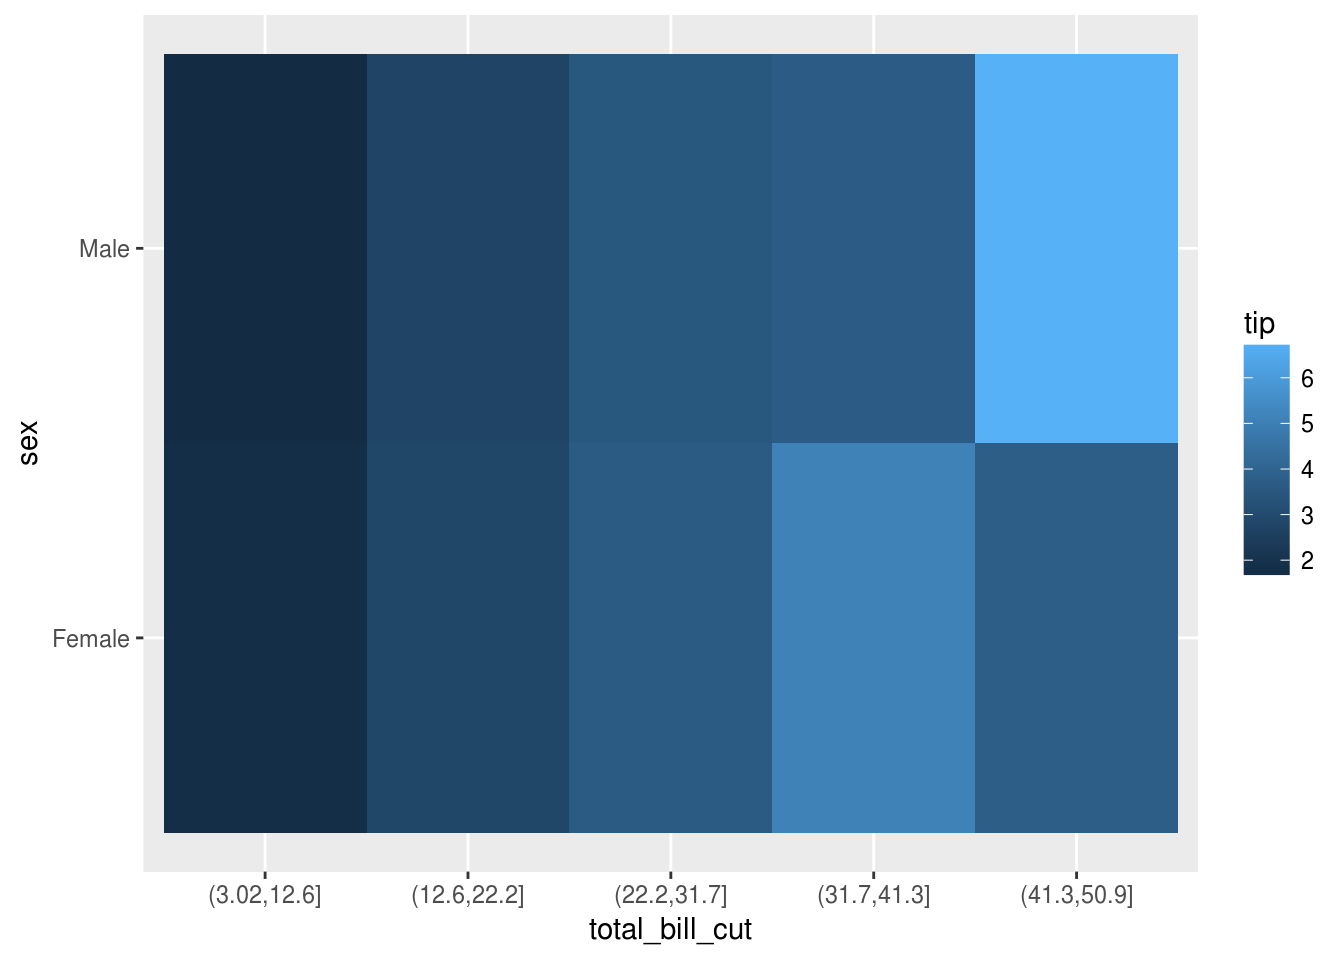
Idem avec smoker en plus
ggplot(tips, aes(total_bill, tip, color = sex)) +
    geom_point() +
    geom_smooth(method = "lm") +
    facet_grid(~ smoker, labeller = label_both)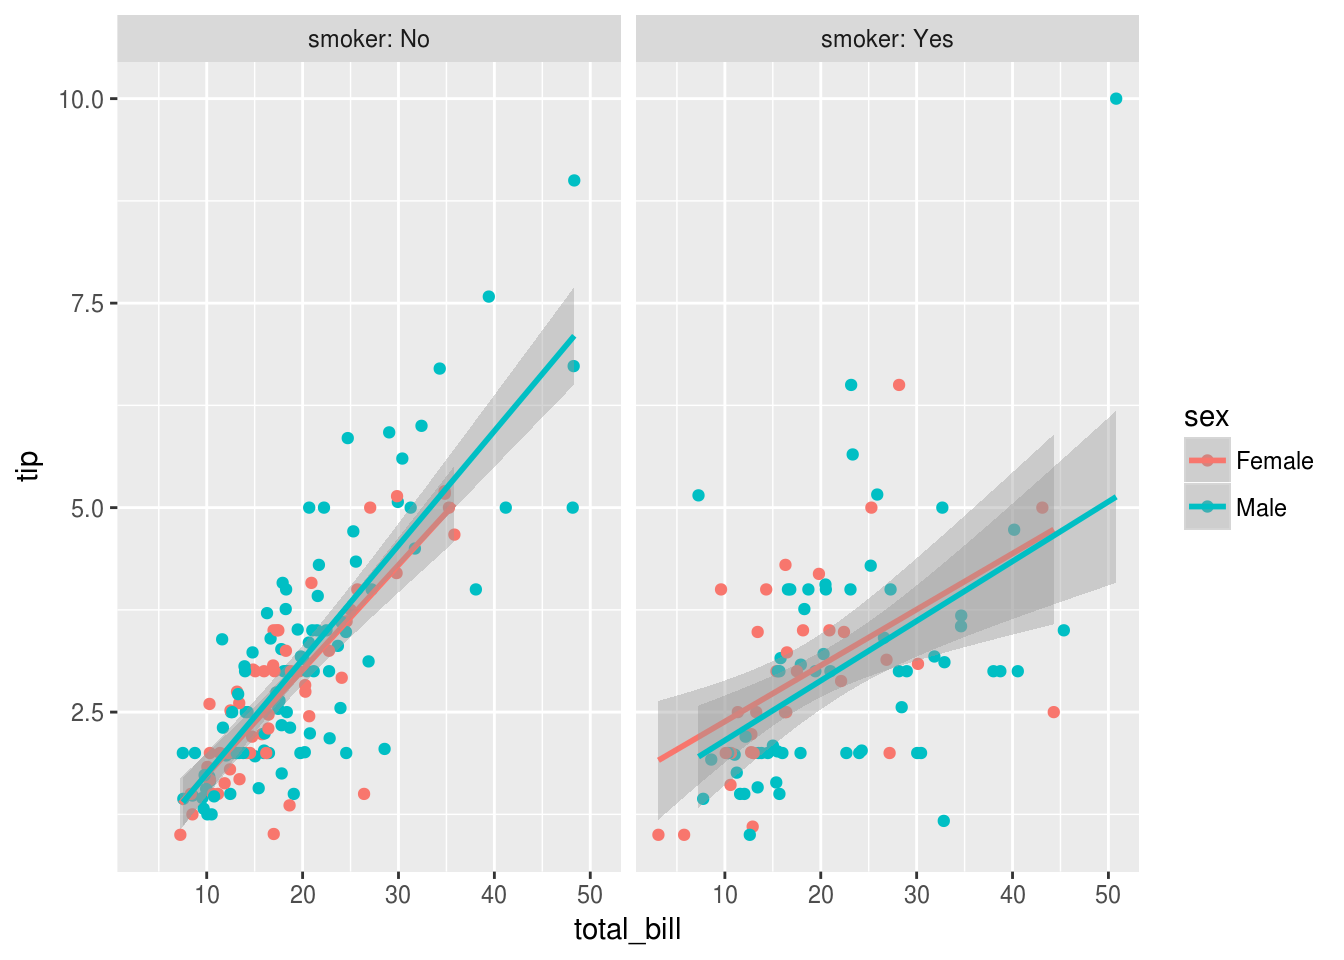
ggplot(tips, aes(total_bill, tip)) +
    geom_point() +
    geom_smooth(method = "lm", fullrange = T) +
    facet_grid(smoker ~ sex, labeller = label_both)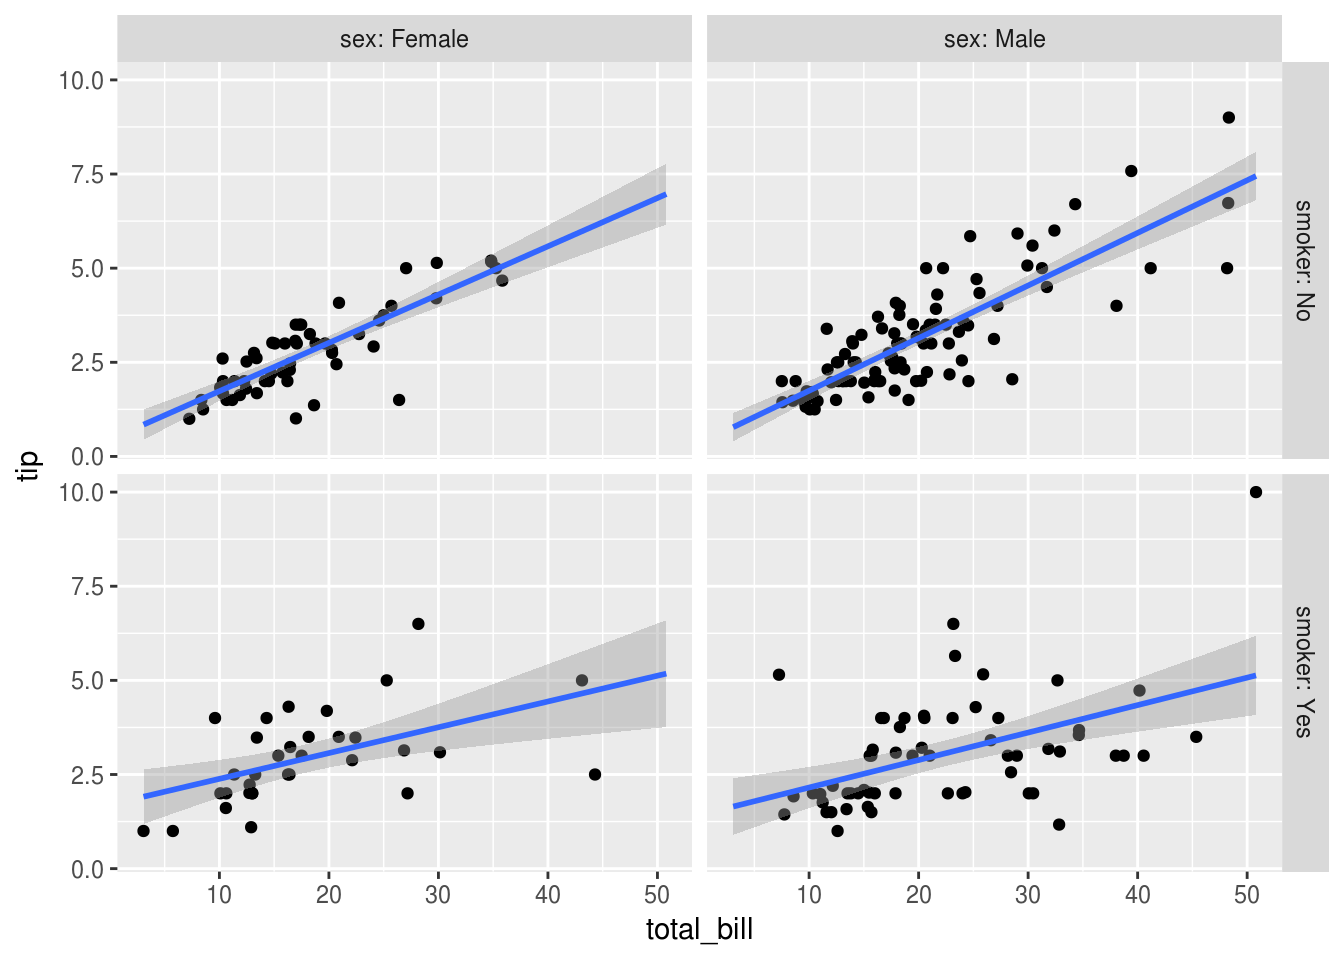
Anscombe
bonus : à partir des données anscombe, refaire le graphique suivant
ans = rbind(
    transform(setNames(subset(anscombe, select = c(x1, y1)), c("x", "y")), ex = 1),
    transform(setNames(subset(anscombe, select = c(x2, y2)), c("x", "y")), ex = 2),
    transform(setNames(subset(anscombe, select = c(x3, y3)), c("x", "y")), ex = 3),
    transform(setNames(subset(anscombe, select = c(x4, y4)), c("x", "y")), ex = 4)
)
ggplot(ans, aes(x, y)) +
    geom_point() +
    geom_smooth(method = "lm", fullrange = T, se = FALSE) +
    facet_wrap(~ ex)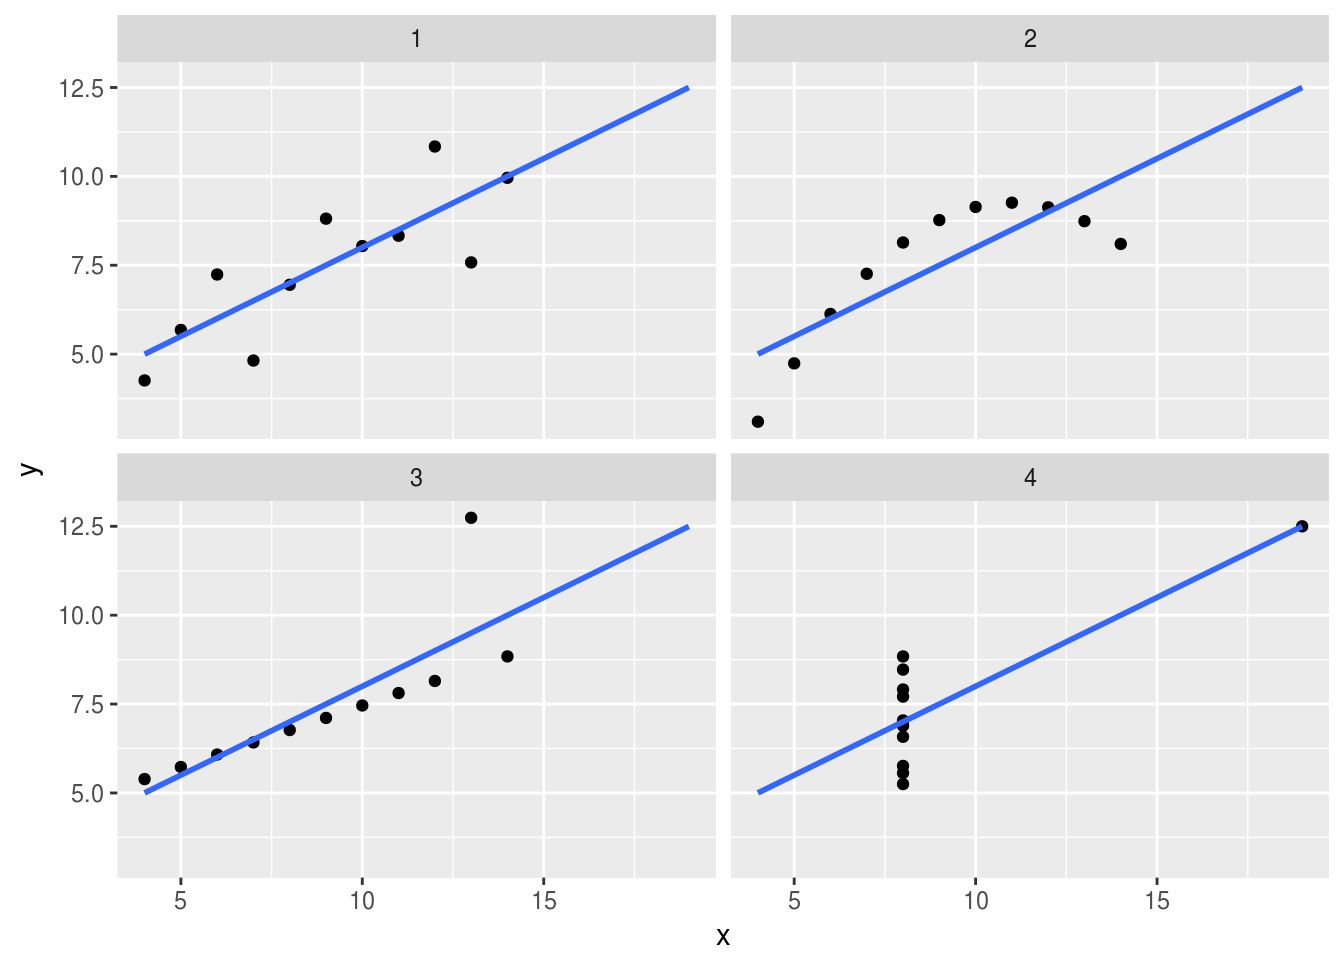
Comment répondre aux questions suivantes :
Les pourboires (
tip) dépendent ils du montant (total_bill)Et des jours de la semaine (
day) ?Et du nombre de convives (
size) ?Croiser
tipen fonction detotal_billetsize